Lessons Learned Writing Java and Kotlin Microbenchmarks
16 Sep 2017I’m presenting a session, The Cost of Kotlin Language Features, at KotlinConf in November. In the best scientific tradition I proposed the session because I was interested in the topic, knew little about it, and wanted to be forced to learn. That’ll teach me!
Coincidentally, the day that my proposal was accepted, Christophe Beyls published a series of 3 articles on Medium titled Exploring Kotlin’s hidden costs. Well that was pleasing - Jetbrains were paying for me to go to San Francisco and Christophe was doing all the work! I filed the links for later plagarism research and got on with booking flights.
Later that month Renato Athaydes went even further. Christophe had inferred costs by examining the generated bytecode, but Renato pointed out that it is notoriously difficult to predict Java’s performance from examining the code because of the HotSpot JIT compiler. So he wrote some JMH benchmarks to measure the actual performance and published the results in Kotlin’s hidden costs - Benchmarks. As my conference proposal had promised both bytecode analysis and benchmarks, this concluded my work and I got on with my day job.
Except that there was a nagging doubt remaining - both from my own reading of his results and other peoples comments. Oh dear, I am actually going to have to understand this stuff if I’m to present at a conference.
So I set to writing some benchmarks of my own to understand how they work. (At the time of writing these are work in progress, so I’d welcome feedback, but please be gentle.) I quickly learned how hard it is to force a computer to do any calculation that you then ignore, and not to effectively inline any value that you don’t change. A good guide to working through these issues is JMH Java Microbenchmark Harness.
Even once I had introduced @State, used a Blackhole, and run enough warmup iterations that HotSpot would do its thing, I still got some perplexing results. To understand why they were odd we need some more background.
How JMH runs benchmarks
JMH works (by default) by running benchmark methods in a tight loop until 1 second has elapsed, counting the number of loops in that time. These 1 s iterations are repeated a configurable number of times, proceeded by a configurable number of 1 s warmup iterations whose times are reported, but ignored. All iterations for a single benchmark are performed in a separate VM than that orchestrating the measurements, with new VMs created to an outer batch.
The default settings are 10 (serial) JVM forks, in each of which 20 warmup iterations are performed followed by 20 measurements, for a total of 200 1 s iterations per benchmark.
You can select multiple benchmarks for a run by regex, these will be run one after the other by the same orchestrator. So if there are 3 benchmarks there will be 30 forked VMs created, and 600 total measurement iterations.
Here is an example of JMH output at the start of a run
# JMH version: 1.19
# VM version: JDK 1.8.0_131, VM 25.131-b11
# VM invoker: /Library/Java/JavaVirtualMachines/jdk1.8.0_131.jdk/Contents/Home/jre/bin/java
# VM options: <none>
# Warmup: 20 iterations, 1 s each
# Measurement: 20 iterations, 1 s each
# Timeout: 10 min per iteration
# Threads: 1 thread, will synchronize iterations
# Benchmark mode: Throughput, ops/time
# Benchmark: com.oneeyedmen.kostings.baselines.JavaBaseline.baseline

# Run progress: 0.00% complete, ETA 00:13:20
# Fork: 1 of 10
# Warmup Iteration   1: 293010554.087 ops/s
# Warmup Iteration   2: 296380175.612 ops/s
...
# Warmup Iteration  20: 367022161.575 ops/s
Iteration   1: 369132107.601 ops/s
Iteration   2: 368540396.014 ops/s
...
Iteration  20: 355492595.855 ops/s

# Run progress: 5.00% complete, ETA 00:12:56
# Fork: 2 of 10
# Warmup Iteration   1: 267261211.186 ops/s
...
How JMH reports benchmarks
Once all the measurement iterations in all the forks for a benchmark are complete, JMH reports the average throughput for that benchmark, together with the 99.9% confidence interval, assuming a Gaussian distribution. So that run finished with this report
# Run complete. Total time: 00:13:31

Benchmark                 Mode  Cnt          Score         Error  Units
JavaBaseline.baseline    thrpt  200  359400874.797 ± 3190513.351  ops/s
KotlinBaseline.baseline  thrpt  200  363343435.012 ± 5184390.204  ops/s
There’s a lot of spurious precision going on there, making it hard to see the wood for the trees. Luckily JMH can also output to a CSV file,
"Benchmark","Mode","Threads","Samples","Score","Score Error (99.9%)","Unit"
"com.oneeyedmen.kostings.baselines.JavaBaseline.baseline","thrpt",1,200,359400874.797,3190513.351,"ops/s"
"com.oneeyedmen.kostings.baselines.KotlinBaseline.baseline","thrpt",1,200,363343435.012,5184390.204,"ops/s"
and we can use that to generate graphs that humans can read. Here we show the 99.9% confidence interval with error bars.
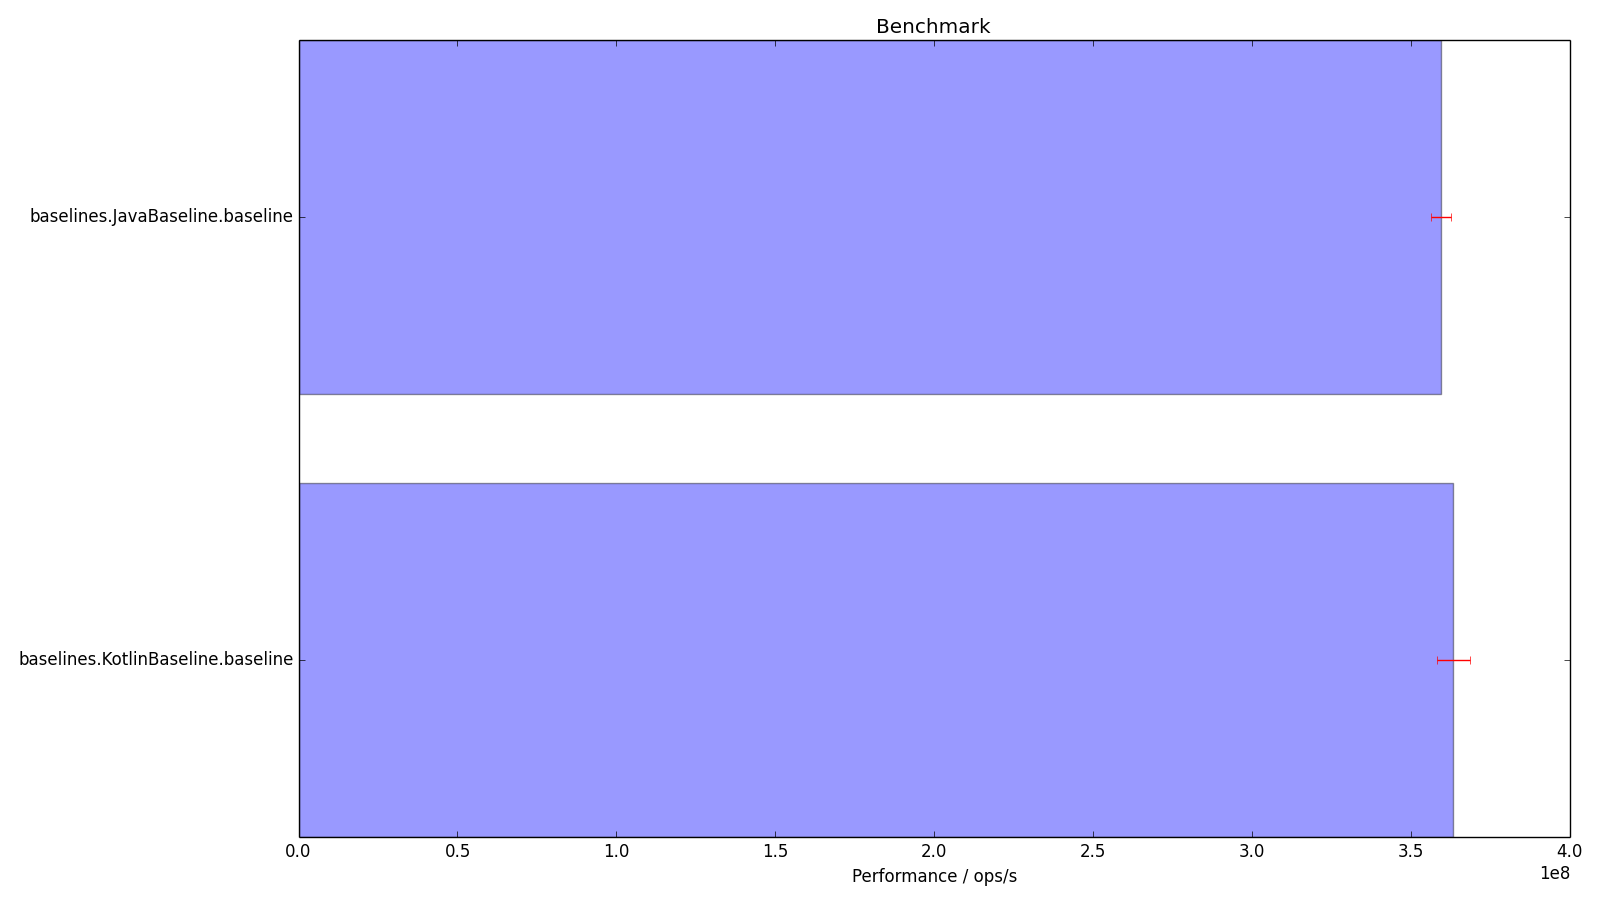
Interpreting relative results
Here is the code that was being benchmarked.
public class JavaBaseline {
    @Benchmark public void baseline(StringState state, Blackhole blackhole) {
        blackhole.consume(state);
    }
}
open class KotlinBaseline {
    @Benchmark fun baseline(state: StringState, blackhole: Blackhole) {
        blackhole.consume(state)
    }
}
Looking at the histogram, this leaves us with a problem - the Kotlin code seems to be quicker, despite doing the same thing. The results say that there is a 99.9% chance that the Java is not faster than 362,591,388 ops/s, and a 99.9% chance that the Kotlin as not slower than 358,159,044 ops/s. This leaves an overlap between their confidence levels that allows Java to be faster, but with not much confidence (is someone able to do the maths?).
Is it possible that Java is likely slower than Kotlin for this benchmark, as the results suggest?
Let’s look at the bytecode. First Java
  // access flags 0x1
  public baseline(Lcom/oneeyedmen/kostings/strings/StringState;Lorg/openjdk/jmh/infra/Blackhole;)V
  @Lorg/openjdk/jmh/annotations/Benchmark;()
   L0
    LINENUMBER 12 L0
    ALOAD 2
    ALOAD 1
    INVOKEVIRTUAL org/openjdk/jmh/infra/Blackhole.consume (Ljava/lang/Object;)V
   L1
    LINENUMBER 13 L1
    RETURN
   L2
    LOCALVARIABLE this Lcom/oneeyedmen/kostings/baselines/JavaBaseline; L0 L2 0
    LOCALVARIABLE state Lcom/oneeyedmen/kostings/strings/StringState; L0 L2 1
    LOCALVARIABLE blackhole Lorg/openjdk/jmh/infra/Blackhole; L0 L2 2
    MAXSTACK = 2
    MAXLOCALS = 3
and then Kotlin
  // access flags 0x11
  public final baseline(Lcom/oneeyedmen/kostings/strings/StringState;Lorg/openjdk/jmh/infra/Blackhole;)V
  @Lorg/openjdk/jmh/annotations/Benchmark;()
    @Lorg/jetbrains/annotations/NotNull;() // invisible, parameter 0
    @Lorg/jetbrains/annotations/NotNull;() // invisible, parameter 1
   L0
    ALOAD 1
    LDC "state"
    INVOKESTATIC kotlin/jvm/internal/Intrinsics.checkParameterIsNotNull (Ljava/lang/Object;Ljava/lang/String;)V
    ALOAD 2
    LDC "blackhole"
    INVOKESTATIC kotlin/jvm/internal/Intrinsics.checkParameterIsNotNull (Ljava/lang/Object;Ljava/lang/String;)V
   L1
    LINENUMBER 15 L1
    ALOAD 2
    ALOAD 1
    INVOKEVIRTUAL org/openjdk/jmh/infra/Blackhole.consume (Ljava/lang/Object;)V
   L2
    LINENUMBER 16 L2
    RETURN
   L3
    LOCALVARIABLE this Lcom/oneeyedmen/kostings/baselines/KotlinBaseline; L0 L3 0
    LOCALVARIABLE state Lcom/oneeyedmen/kostings/strings/StringState; L0 L3 1
    LOCALVARIABLE blackhole Lorg/openjdk/jmh/infra/Blackhole; L0 L3 2
    MAXSTACK = 2
    MAXLOCALS = 3
So Kotlin is checking the parameters aren’t null, and running the exact same code as the Java. Unless HotSpot is able to deduce that some later code doesn’t have to be run because Kotlin has made this check, I can’t see any way that the Java can be slower, but our benchmarks show that it is, probably.
Running a number of different benchmarks, with different fork counts, and different numbers of iterations, produced many of these perverse results. The numbers can’t lie, but are we asking them the right question?
Systematic Errors
The confidence intervals given by JMH are based only on the measurements that it has taken - they aren’t a reflection of the actual truth. In order to get an idea of what causes the measurement variation that we interpret as errors, we have to drill further into the data.
In addition to the CSV output, JMH has a JSON output.
{
    "lots-of-stuff-deleted": "..."
    "warmupIterations" : 20,
    "warmupTime" : "1 s",
    "warmupBatchSize" : 1,
    "measurementIterations" : 20,
    "measurementTime" : "1 s",
    "measurementBatchSize" : 1,
    "primaryMetric" : {
        "score" : 3.656186120562128E8,
        "scoreError" : 1833316.6776747273,
        "scoreConfidence" : [
            3.637852953785381E8,
            3.674519287338875E8
        ],
        "scorePercentiles" : {
            "0.0" : 3.168042199792653E8,
            "50.0" : 3.654796412185938E8,
            "90.0" : 3.7526561404113406E8,
            "95.0" : 3.781350703702088E8,
            "99.0" : 3.821109699100871E8,
            "99.9" : 3.8282245766638625E8,
            "99.99" : 3.8282245766638625E8,
            "99.999" : 3.8282245766638625E8,
            "99.9999" : 3.8282245766638625E8,
            "100.0" : 3.8282245766638625E8
        },
        "scoreUnit" : "ops/s",
        "rawData" : [
            [
                3.599636727894533E8,
                3.670631984977747E8,
                3.678476209011342E8,
                3.750361228656685E8
Here we have access to each measurement. I don’t have the data for the run we’ve just seen, but here are the histograms for another set of benchmarks.
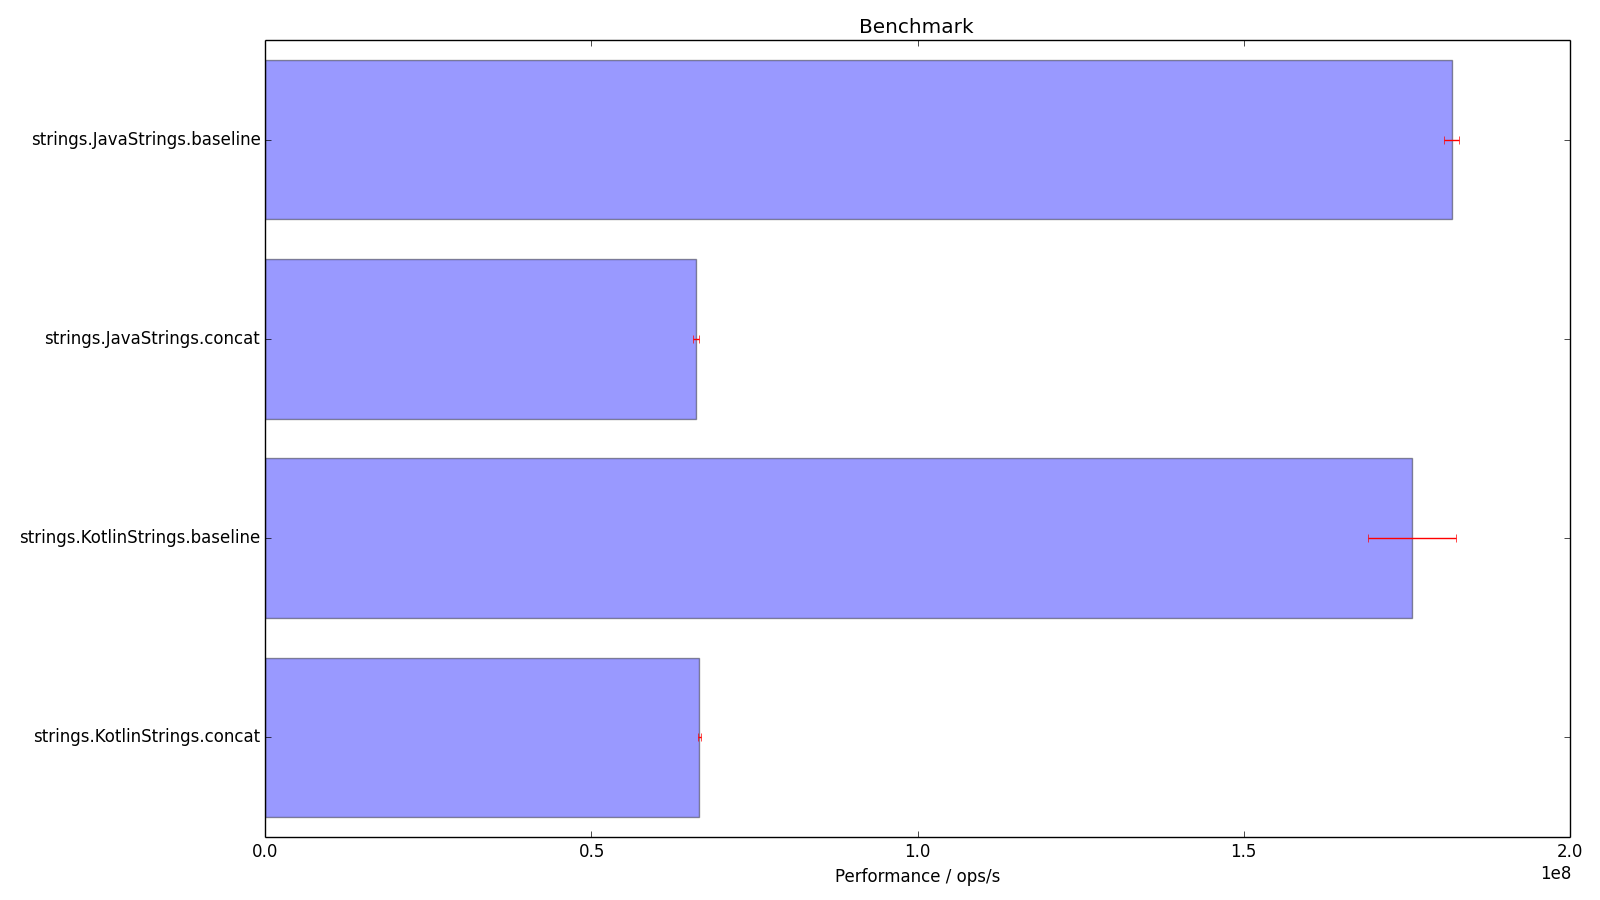
There is a lot of uncertainty in that KotlinStrings.baseline, I wonder what the measurements look like?
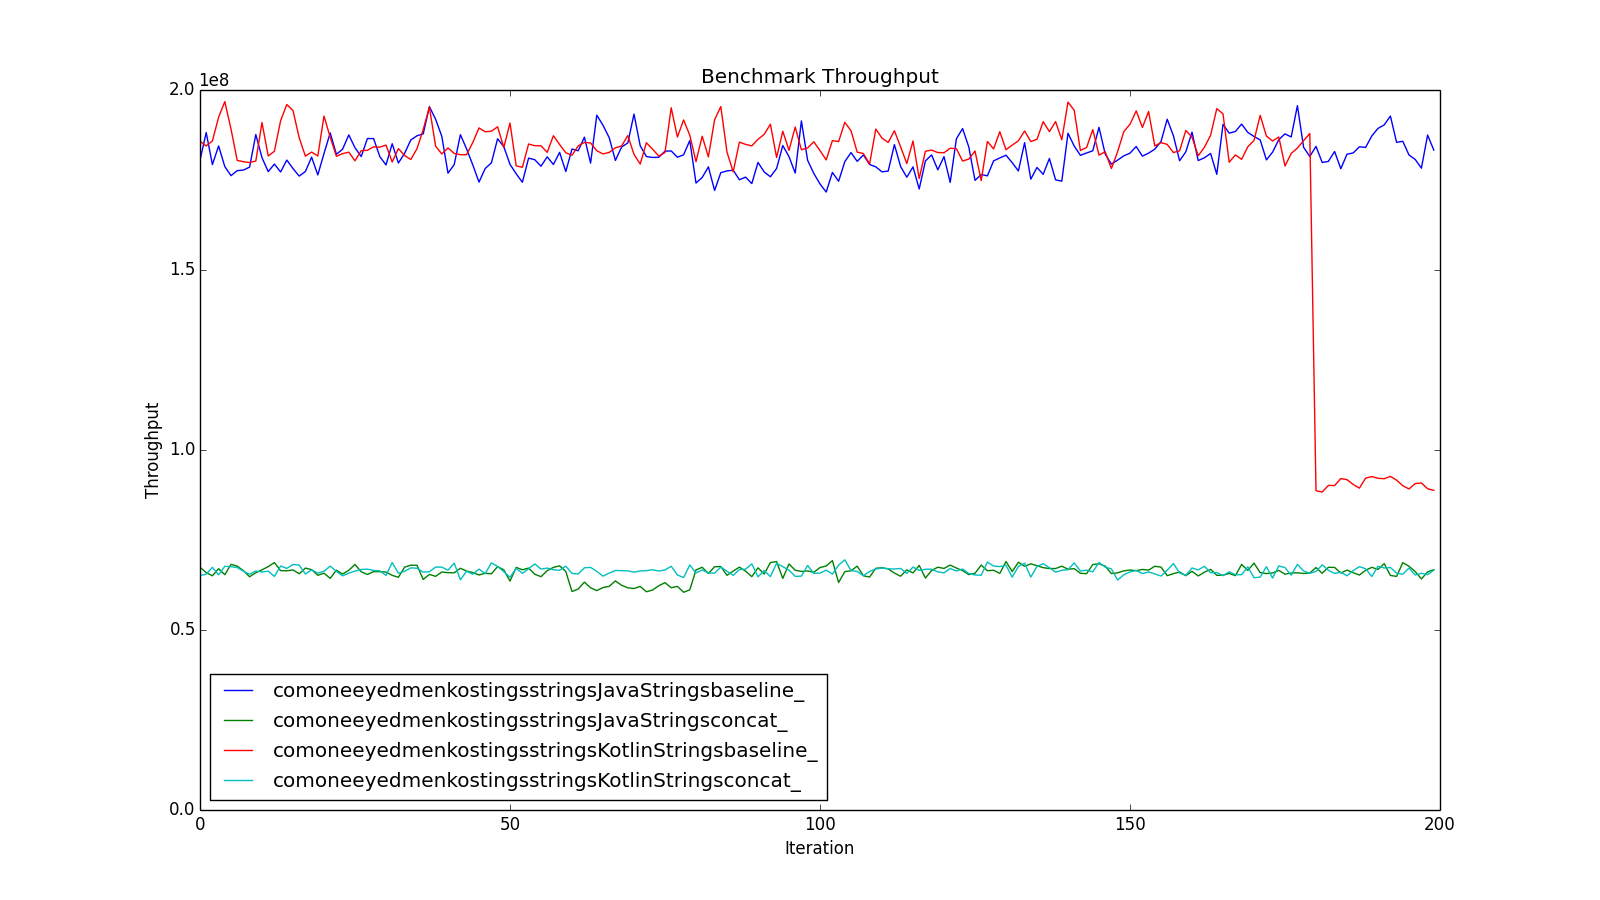
Whoa! I don’t know what went on at the end of that run, but it wasn’t normal. JavaStrings.Concat seems to have taken a wobble around iteration 60 as well. Clearly these results should not be trusted.
Another run gives the following results.
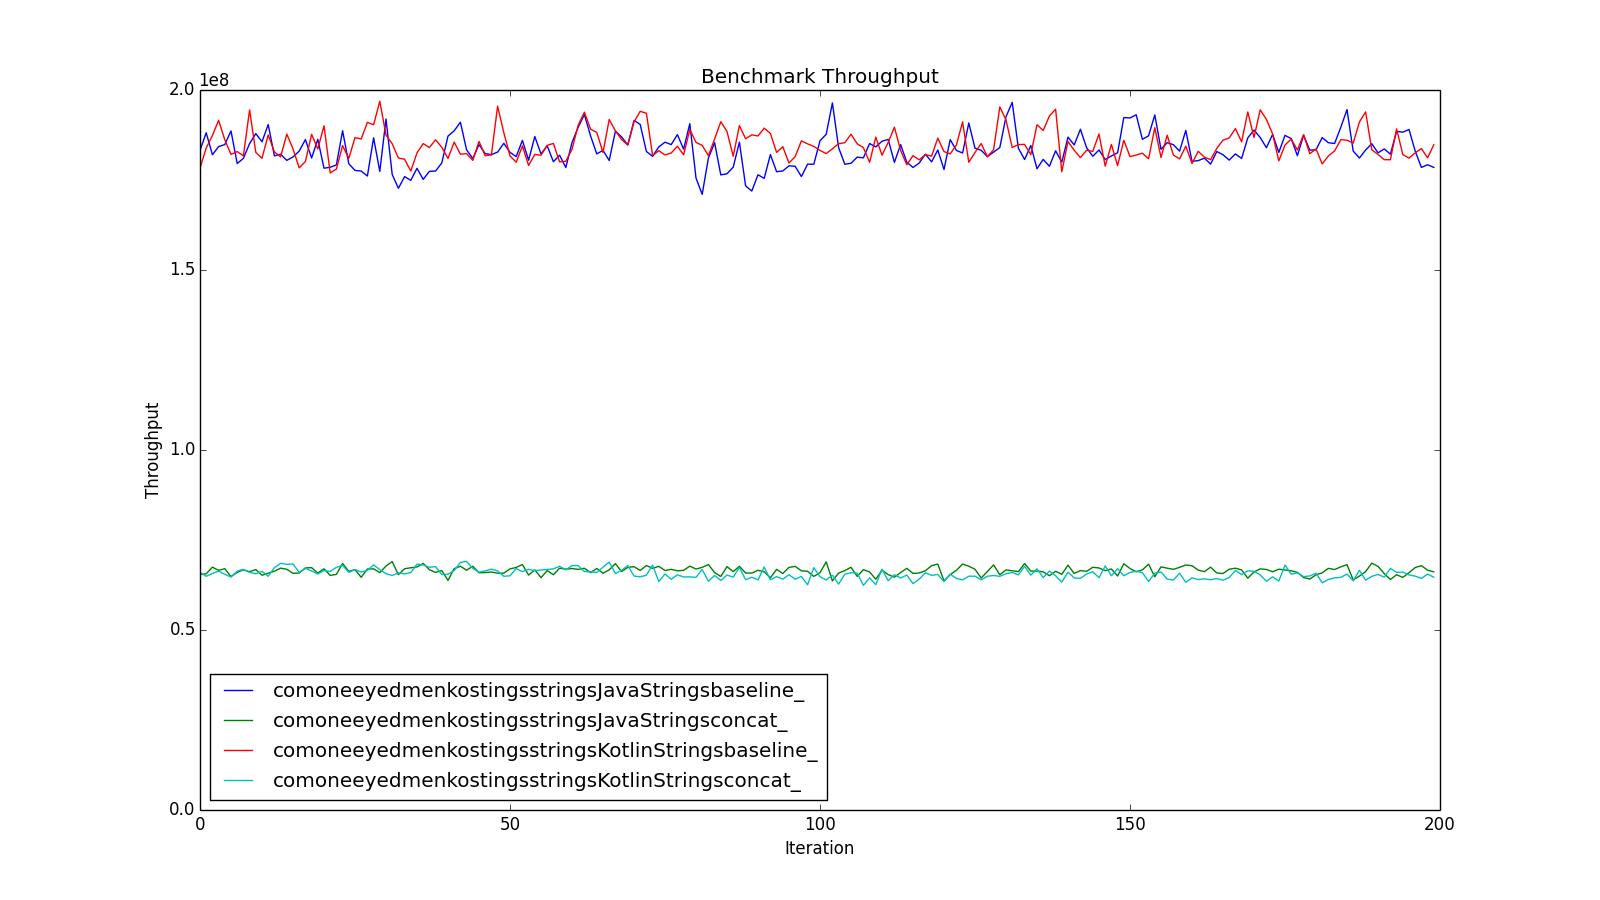
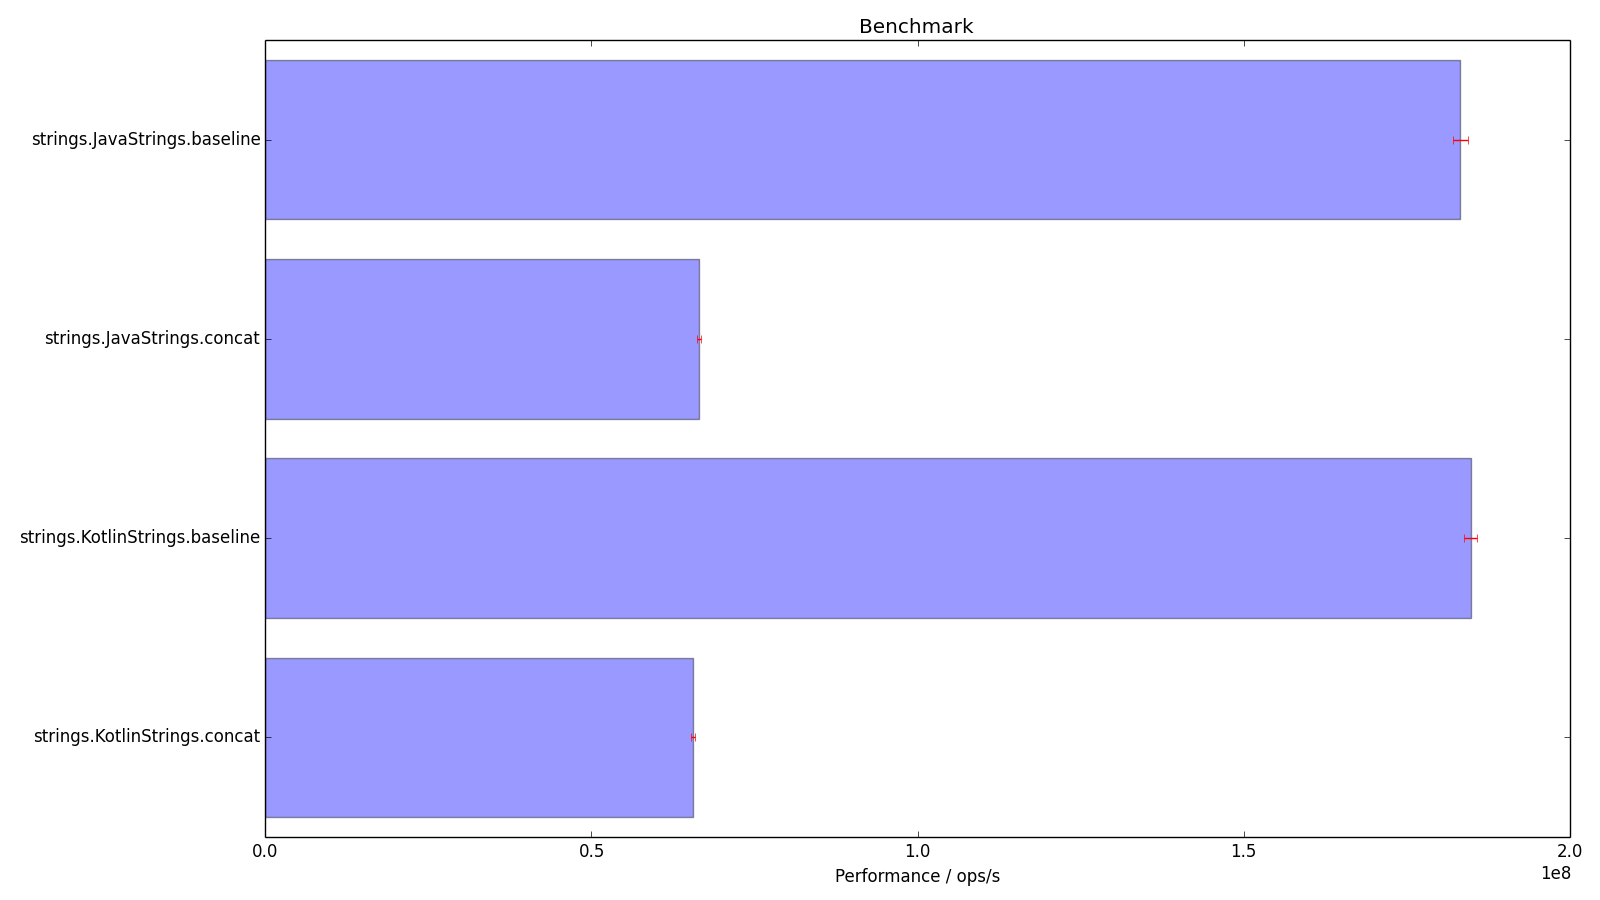
Note the much smaller error bars reflecting the lack of variation in the KotlinStrings.baseline measurements.
Causes of Systematic Errors
What causes dropouts like these? I suppose anything that causes CPU or memory bandwidth to be switched away from the benchmark VM, which is many of the little conveniences that we expect computers to do for us without being asked. To get stable benchmarks on my MacBook Pro I have had to:
- Disable Time Machine, which otherwise backs up after a period of user inactivity.
- Disable CrashPlan, ditto.
- Close IntelliJ, so that it doesn’t refresh it’s indices after noticing the results files being written.
- Make sure Finder isn’t viewing the results folder.
- Disable various agents (Dropbox, Google Earth) which check for updates periodically.
- Disable the screensaver.
- Disable switching off the screen after inactivity.
- Disable sleep after inactivity.
- Not use the computer while the benchmarks are running.
Even then I must have missed something, because looking at the results I still get occasional dropouts, so I now make it a rule to view the graph of throughput for each benchmark batch, and to re-run those which show obviously non-random variation.
Further Investigation
Plotting a histogram of the distribution of measurements might give insight into whether they are random or systematic errors. No-doubt some statistics could be brought to bear to automatically reject results that were not sufficiently Gaussian.
I suspect that Intel Turbo-Boost, where a processor ramps up its clock in response to demand, but then slows down again as it heats up, may be another cause of systematic errors.
Conclusion
Despite the best efforts of JMH to allow the writing of reliable micro-benchmarks, the modern computing environment is complex and it is hard to remove all systematic errors. It is not enough to look at the summarised results - you have to examine the distribution of benchmark measurements to have confidence in the numbers.
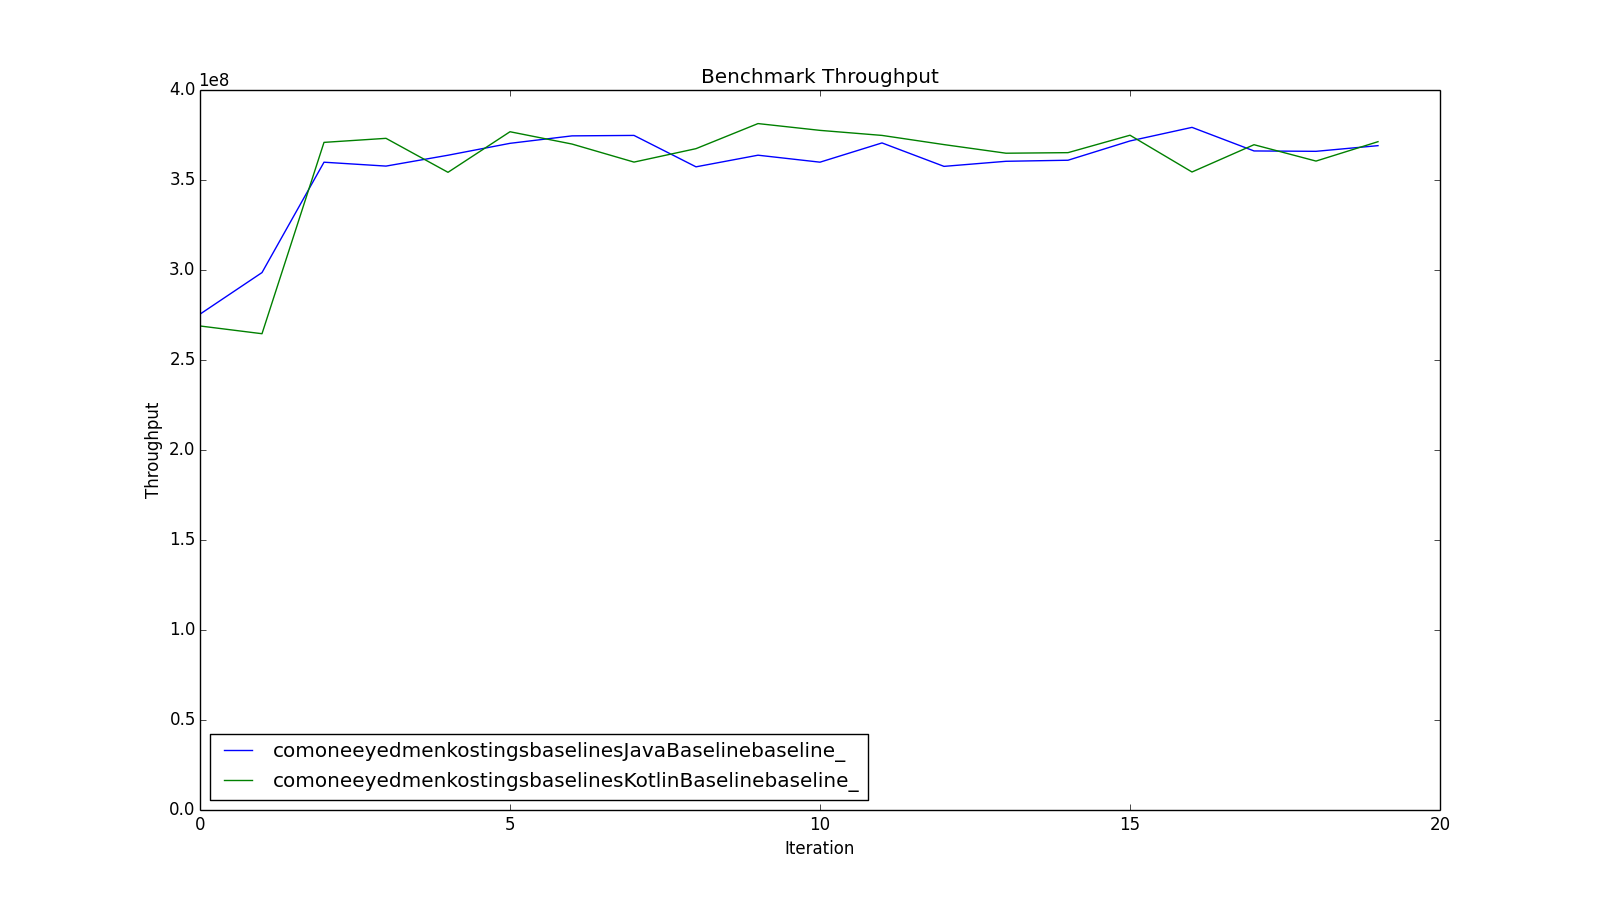
Postscript - Speeding up benchmarks
Needless to say, benchmarking can take time. The default settings take at least 10 * (20 + 20) = 400 s per benchmark. A faster machine doesn’t help much, because each measurement takes 1 s - you just get better fidelity in that measurement. You can speed up a run by scrimping on the warmups - looking at the warmup iteration results for my benchmarks they don’t get noticeably faster after the 3rd iteration, so spending 20 s warming up is just wasting good loops, as this graph, of throughput against iteration with no warmup, shows.
Ideally it would be nice to give JMH a target confidence and have it continue to run a benchmark until that level was reached.
I have also come to the conclusion that the default of 10 forks per benchmark needlessly slows the test run. As long as each benchmark is run in its own VM, it is significantly quicker to run 200 iterations in that than 20 in each of 10. There may be some situations in which the forking is important, but for the micro-benchmarks I am running I have not yet detected any unexpected behaviour using a single fork.